
BNB Price Forecast: BNB dips below $870 as Fed hawkish stance fuels risk aversion
Di Manish Chhetri
Data di Pubblicazione: 11 Dec 2025 | Data di Modifica: 11 Dec 2025


ARTICOLI POPOLARI

BNB (BNB), formerly known as Binance Coin, is extending its correction, trading below $870 at the time of writing on Thursday as risk sentiment across the crypto market deteriorated in response to the Federal Reserve’s (Fed) hawkish rate cut.
- BNB falls below $870 on broader market risk aversion triggered by the Federal Reserve’s hawkish rate cut.
- On-chain data show seller bets prevail, while futures metrics point to rising retail activity in detriment of whales.
- Technical indicators suggest continued weakness, with bears eyeing a move toward levels below $850.
BNB (BNB), formerly known as Binance Coin, is extending its correction, trading below $870 at the time of writing on Thursday as risk sentiment across the crypto market deteriorated in response to the Federal Reserve’s (Fed) hawkish rate cut. Weak on-chain and derivatives data further signal a bearish tone, suggesting BNB may face additional downside in the upcoming days.
Fed’s cautious rate cut weighs on riskier assets
The broader crypto market softened after the Federal Open Market Committee (FOMC) meeting on Wednesday. In a widely expected move, the US Federal Reserve (Fed) lowered interest rates by 25 basis points to 3.50%-3.75% at the end of its two-day policy meeting but signaled a likely pause in January.
Adding to the cautious tone, policymakers projected only a one-quarter-percentage-point cut in 2026, the same outlook as in September, which tempered market expectations of two rate cuts and contributed to short-term pressure on risk assets.
This hawkish rate cut and the Fed’s cautious stance triggered a slight risk-off sentiment that was exacerbated by disappointing results from Oracle after the US close. All these factors weighed on riskier assets, with major cryptocurrencies such as Bitcoin (BTC), Ethereum (ETH), Ripple (XRP), Solana (SOL) and BNB trading lower as of Thursday.
On-chain and derivatives data show bearish signs
CryptoQuant data, as shown in the graph below, highlights selling pressure on BNB. The Taker CVD (Cumulative Volume Delta) for BNB turned negative in early October and has been steadily decreasing since then. This indicator measures the cumulative difference between market buy and sell volumes over three months. When the 90-day CVD is positive and increasing, it suggests the Taker Buy Dominant Phase, while a negative and decreasing value indicates the Taker Sell Dominant Phase.
-1765448534115-1765448534116.png)
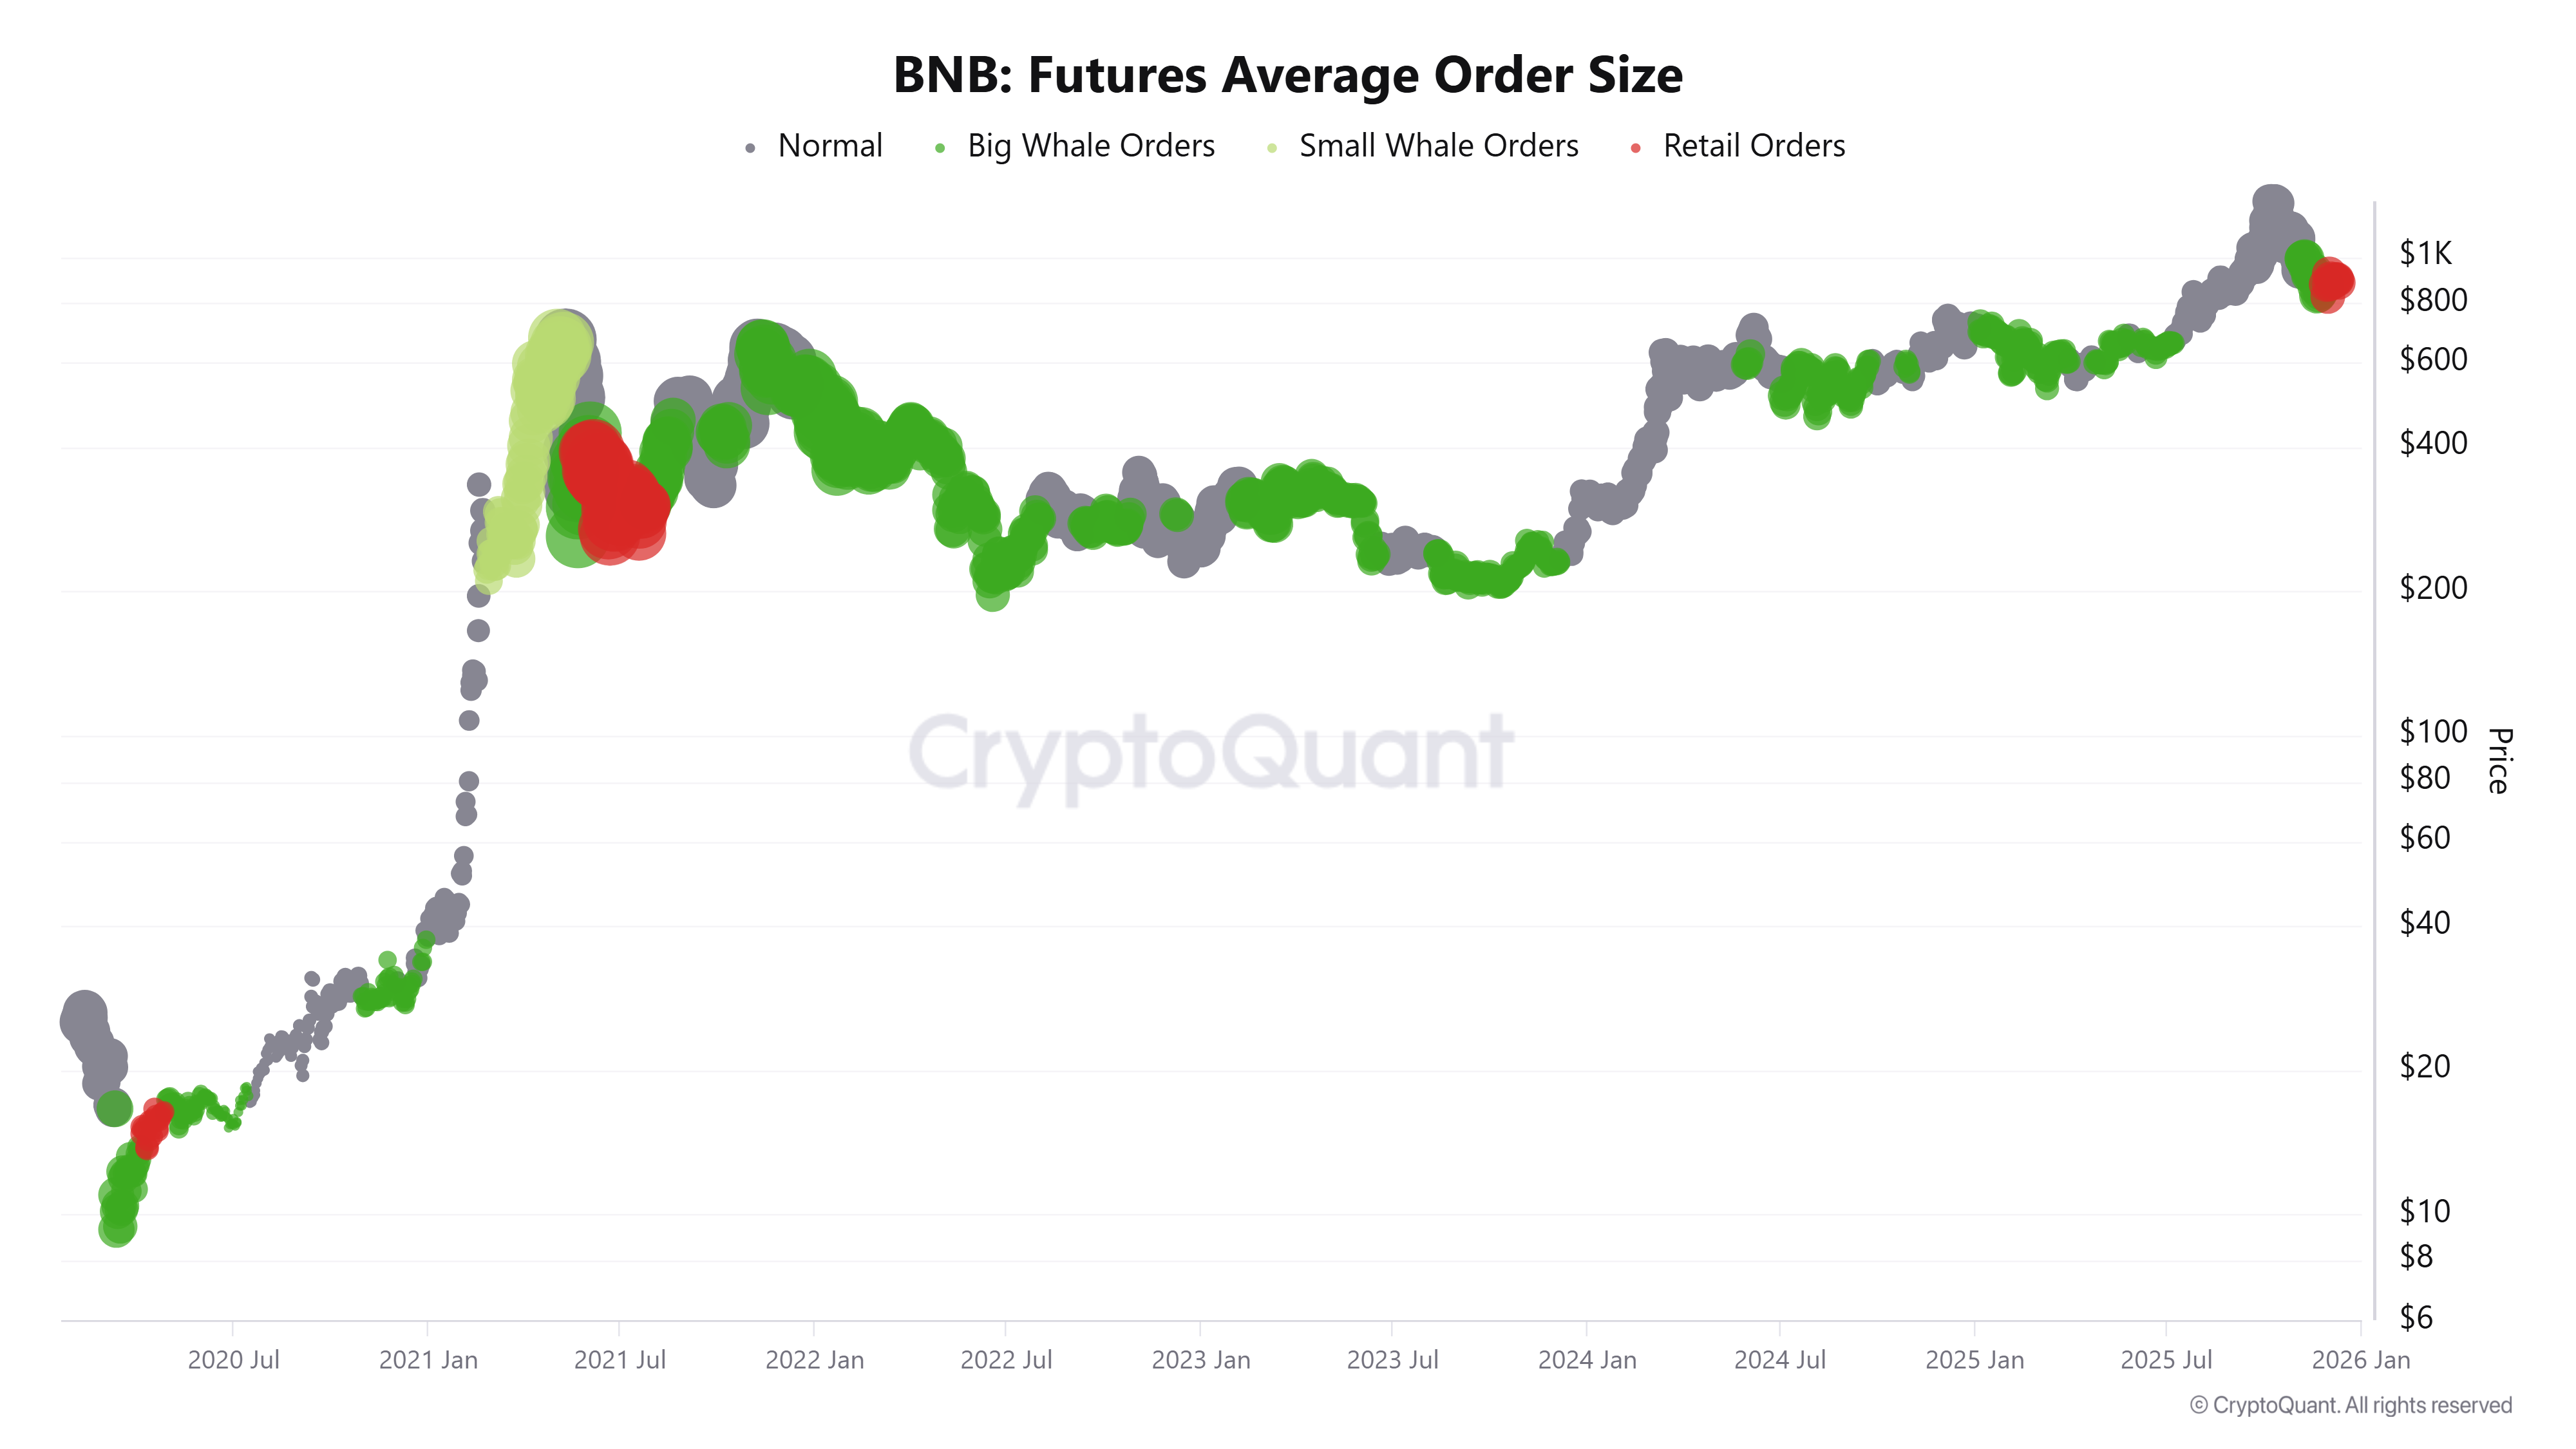
CryptoQuant’s Futures Average Order Size indicator — which tracks the average size of executed BNB futures trades — shows a rise in smaller order sizes, signaling increased retail activity in the market that does not bode well with the BNB price.
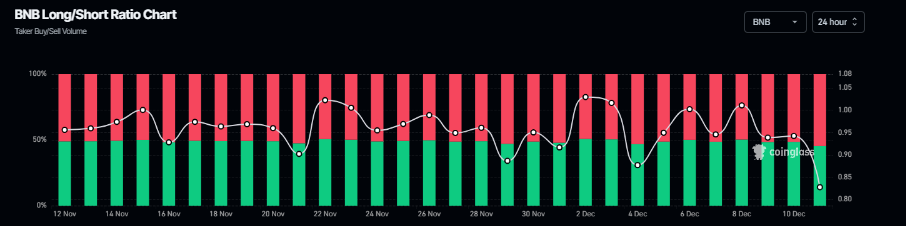
According to Coinglass data, BNB’s long-to-short ratio reads 0.82 on Thursday. This ratio, below one, reflects bearish sentiment in the markets, as more traders are betting on the asset price to fall.
BNB Price Forecast: BNB bears aiming for levels below $850
BNB price was rejected from the descending trendline (drawn by joining multiple highs since mid-October) on Tuesday and declined slightly the next day. At the time of writing on Thursday, BNB continues to trade down at around $866.90.
If BNB continues its correction, it could extend the decline toward the next daily support at $844.
The Relative Strength Index (RSI) on the daily reads 42, below its neutral level of 50 and pointing downward, indicating bearish momentum is increasing.

Looking up, if BNB recovers, it could extend the recovery toward the 50-day Exponential Moving Average (EMA) at $933.53.

Acuity Trading è una fintech con sede a Londra, fondata nel 2013, specializzata in dati alternativi basati su AI e analisi del sentiment per il trading e gli investimenti. Ha rivoluzionato l’esperienza di trading online con strumenti visivi di notizie e sentiment e continua a guidare il mercato con dati alternativi che generano alfa e strumenti di trading altamente coinvolgenti sfruttando le più recenti ricerche e tecnologie AI.
Leggi di più


