
Chainlink Price Forecast: LINK edges higher despite lagging retail and institutional demand
작성자 John Isige
게시일: 23 Dec 2025 | 수정일: 23 Dec 2025


인기 기사

Chainlink (LINK) is trading above $12.50 at the time of writing on Monday, mirroring subtle but positive sentiment in the broader cryptocurrency market. The oracle token is supported by solid short-term technical signals, reinforcing the bullish outlook.
- Chainlink rises above $12.50, with the 50 EMA on the 4-hour chart holding as support.
- Low retail and institutional demand could limit Chainlink’s recovery potential.
- The MACD and the RSI indicators support LINK’s short-term bullish outlook.
Chainlink (LINK) is trading above $12.50 at the time of writing on Monday, mirroring subtle but positive sentiment in the broader cryptocurrency market. The oracle token is supported by solid short-term technical signals, reinforcing the bullish outlook.
However, investors should temper expectations for an extended breakout, considering that both retail and institutional interest in LINK are lagging.
Chainlink trades amid muted retail and institutional activity
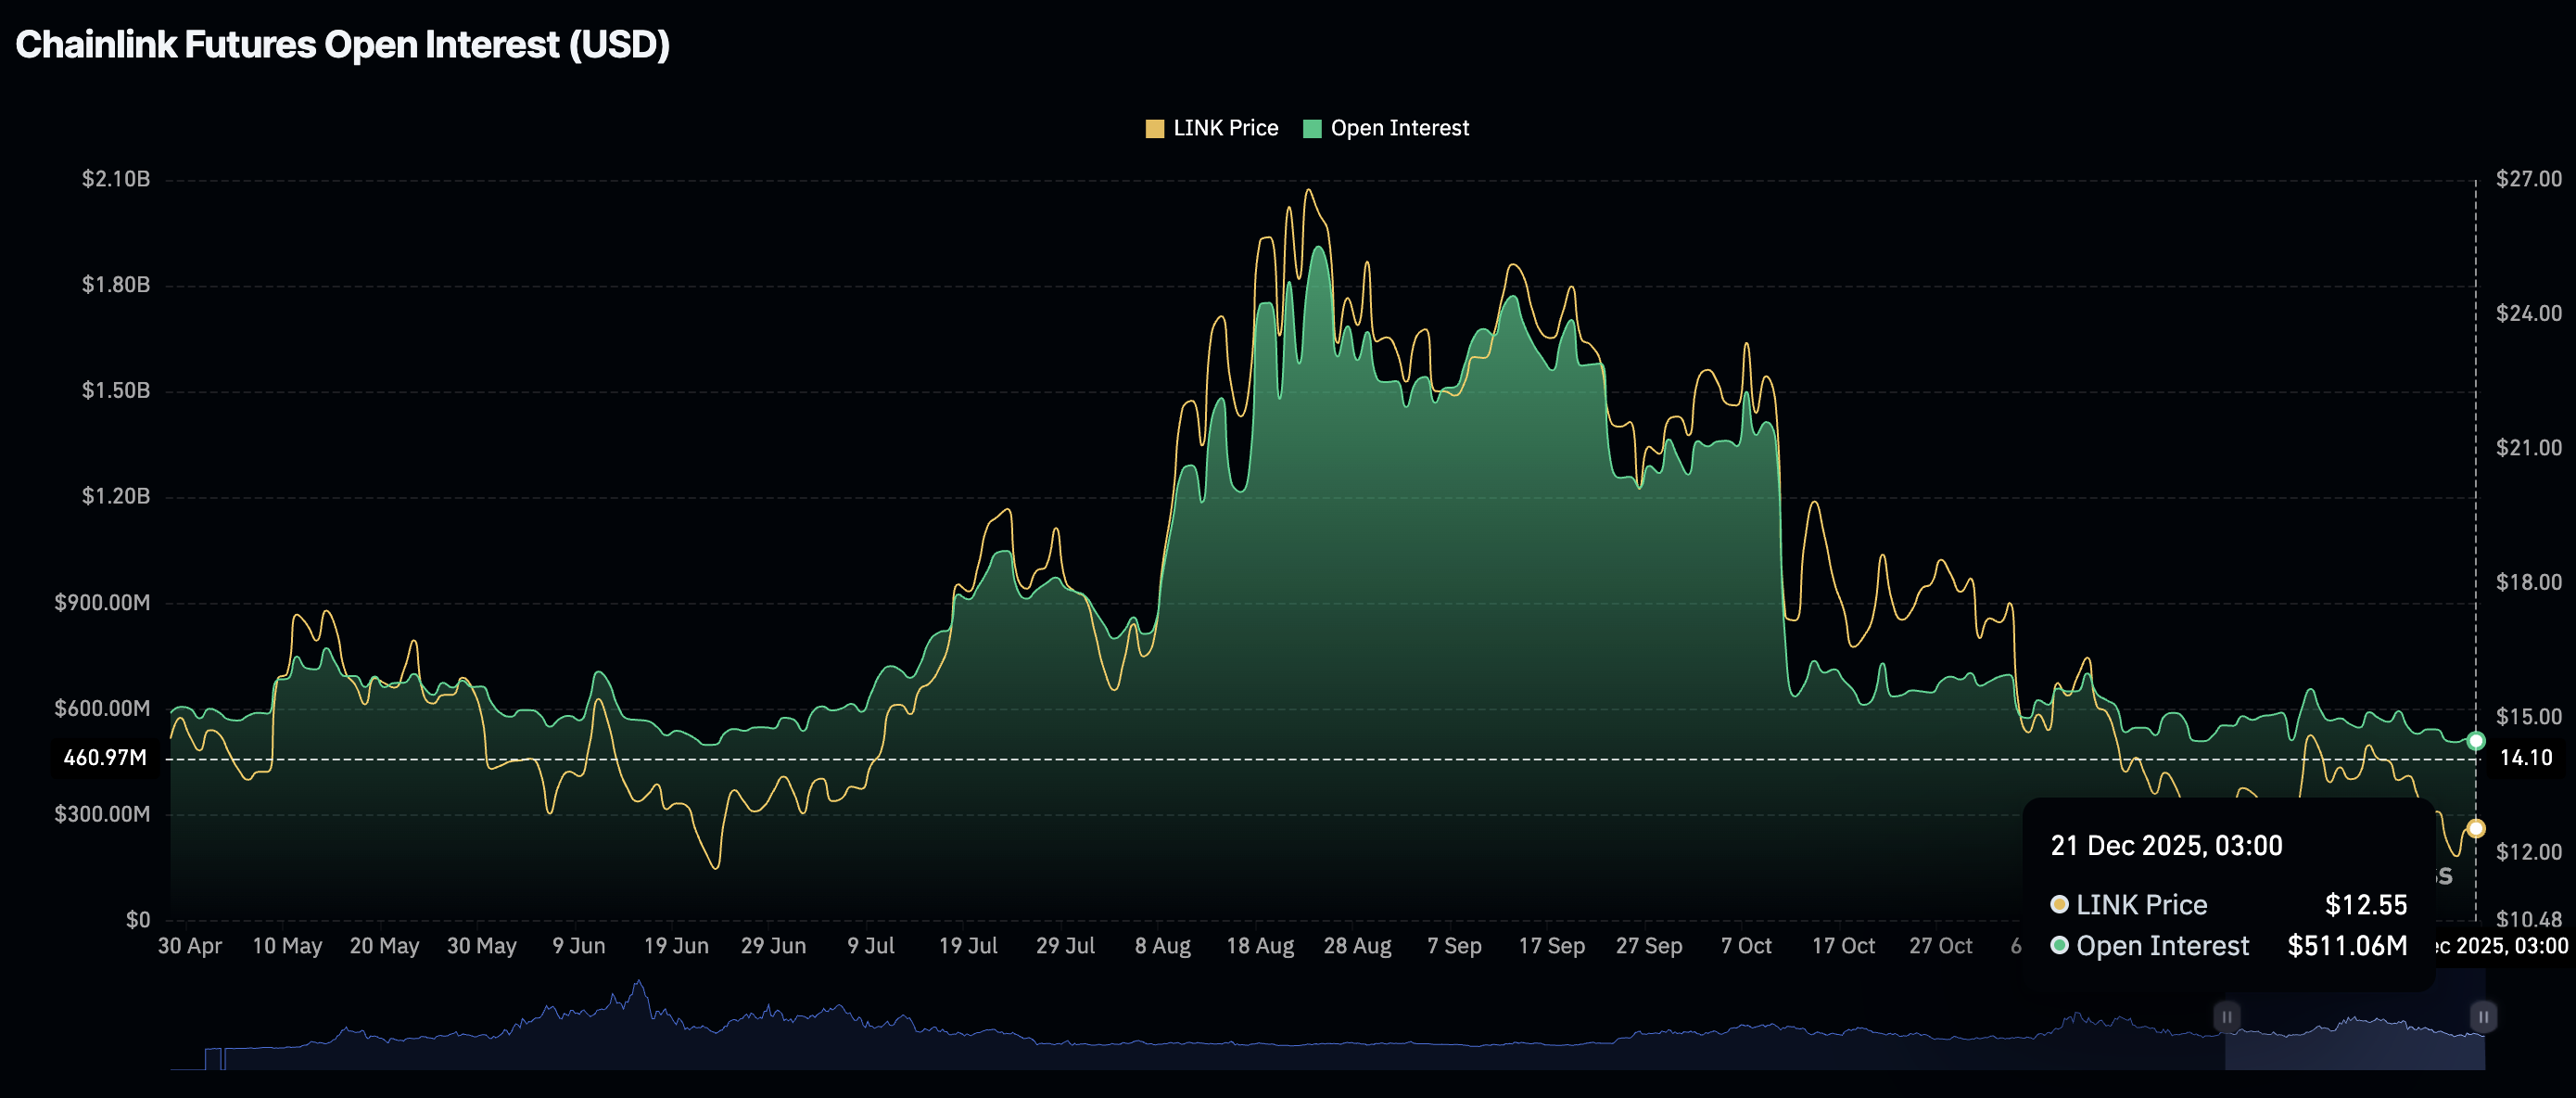
The Chainlink derivatives market has remained under pressure since the October 10 flash crash, with futures Open Interest (OI) averaging $511 million as of Sunday. CoinGlass data shows that OI, which represents the notional value of outstanding futures contracts, averaged $1.36 billion on October 10.
Although relatively high, the OI levels in October marked a significant decline from the record high of $1.95 billion, recorded on August 24. The larger the OI, the higher the retail interest. Hence, a suppressed derivative is a deterrent to the uptrend, potentially dampening LINK’s ongoing recovery.
Meanwhile, Chainlink spot Exchange Traded Funds (ETFs) remained quiet on Thursday and Friday, with no flows recorded. SoSoValue data highlights approximately $217,000 in inflows posted on Wednesday and $1.38 million on Tuesday.
The cumulative net inflow stands at approximately $56 million, with net assets averaging $73 million. Grayscale’s GLNK ETF is the only ETF listed in the United States (US).

Technical outlook: LINK holds support, but upside is still limited
Chainlink is trading above the 50 Exponential Moving Average (EMA) at $12.75 at the time of writing on Monday, following an intraday increase to $12.95.
The Relative Strength Index (RSI) has risen to 58 on the 4-hour chart, signaling increasing momentum as bulls target an extended breakout above the 100 EMA at $13.03.
The Moving Average Convergence Divergence (MACD) indicator on the same chart maintains a buy signal confirmed on Friday, when the blue line crossed above the red signal line.
If the green histogram bars continue to rise above the mean line, investors may be prompted to increase their exposure, thereby increasing the probability that LINK breaks past the 200 EMA at $13.56.
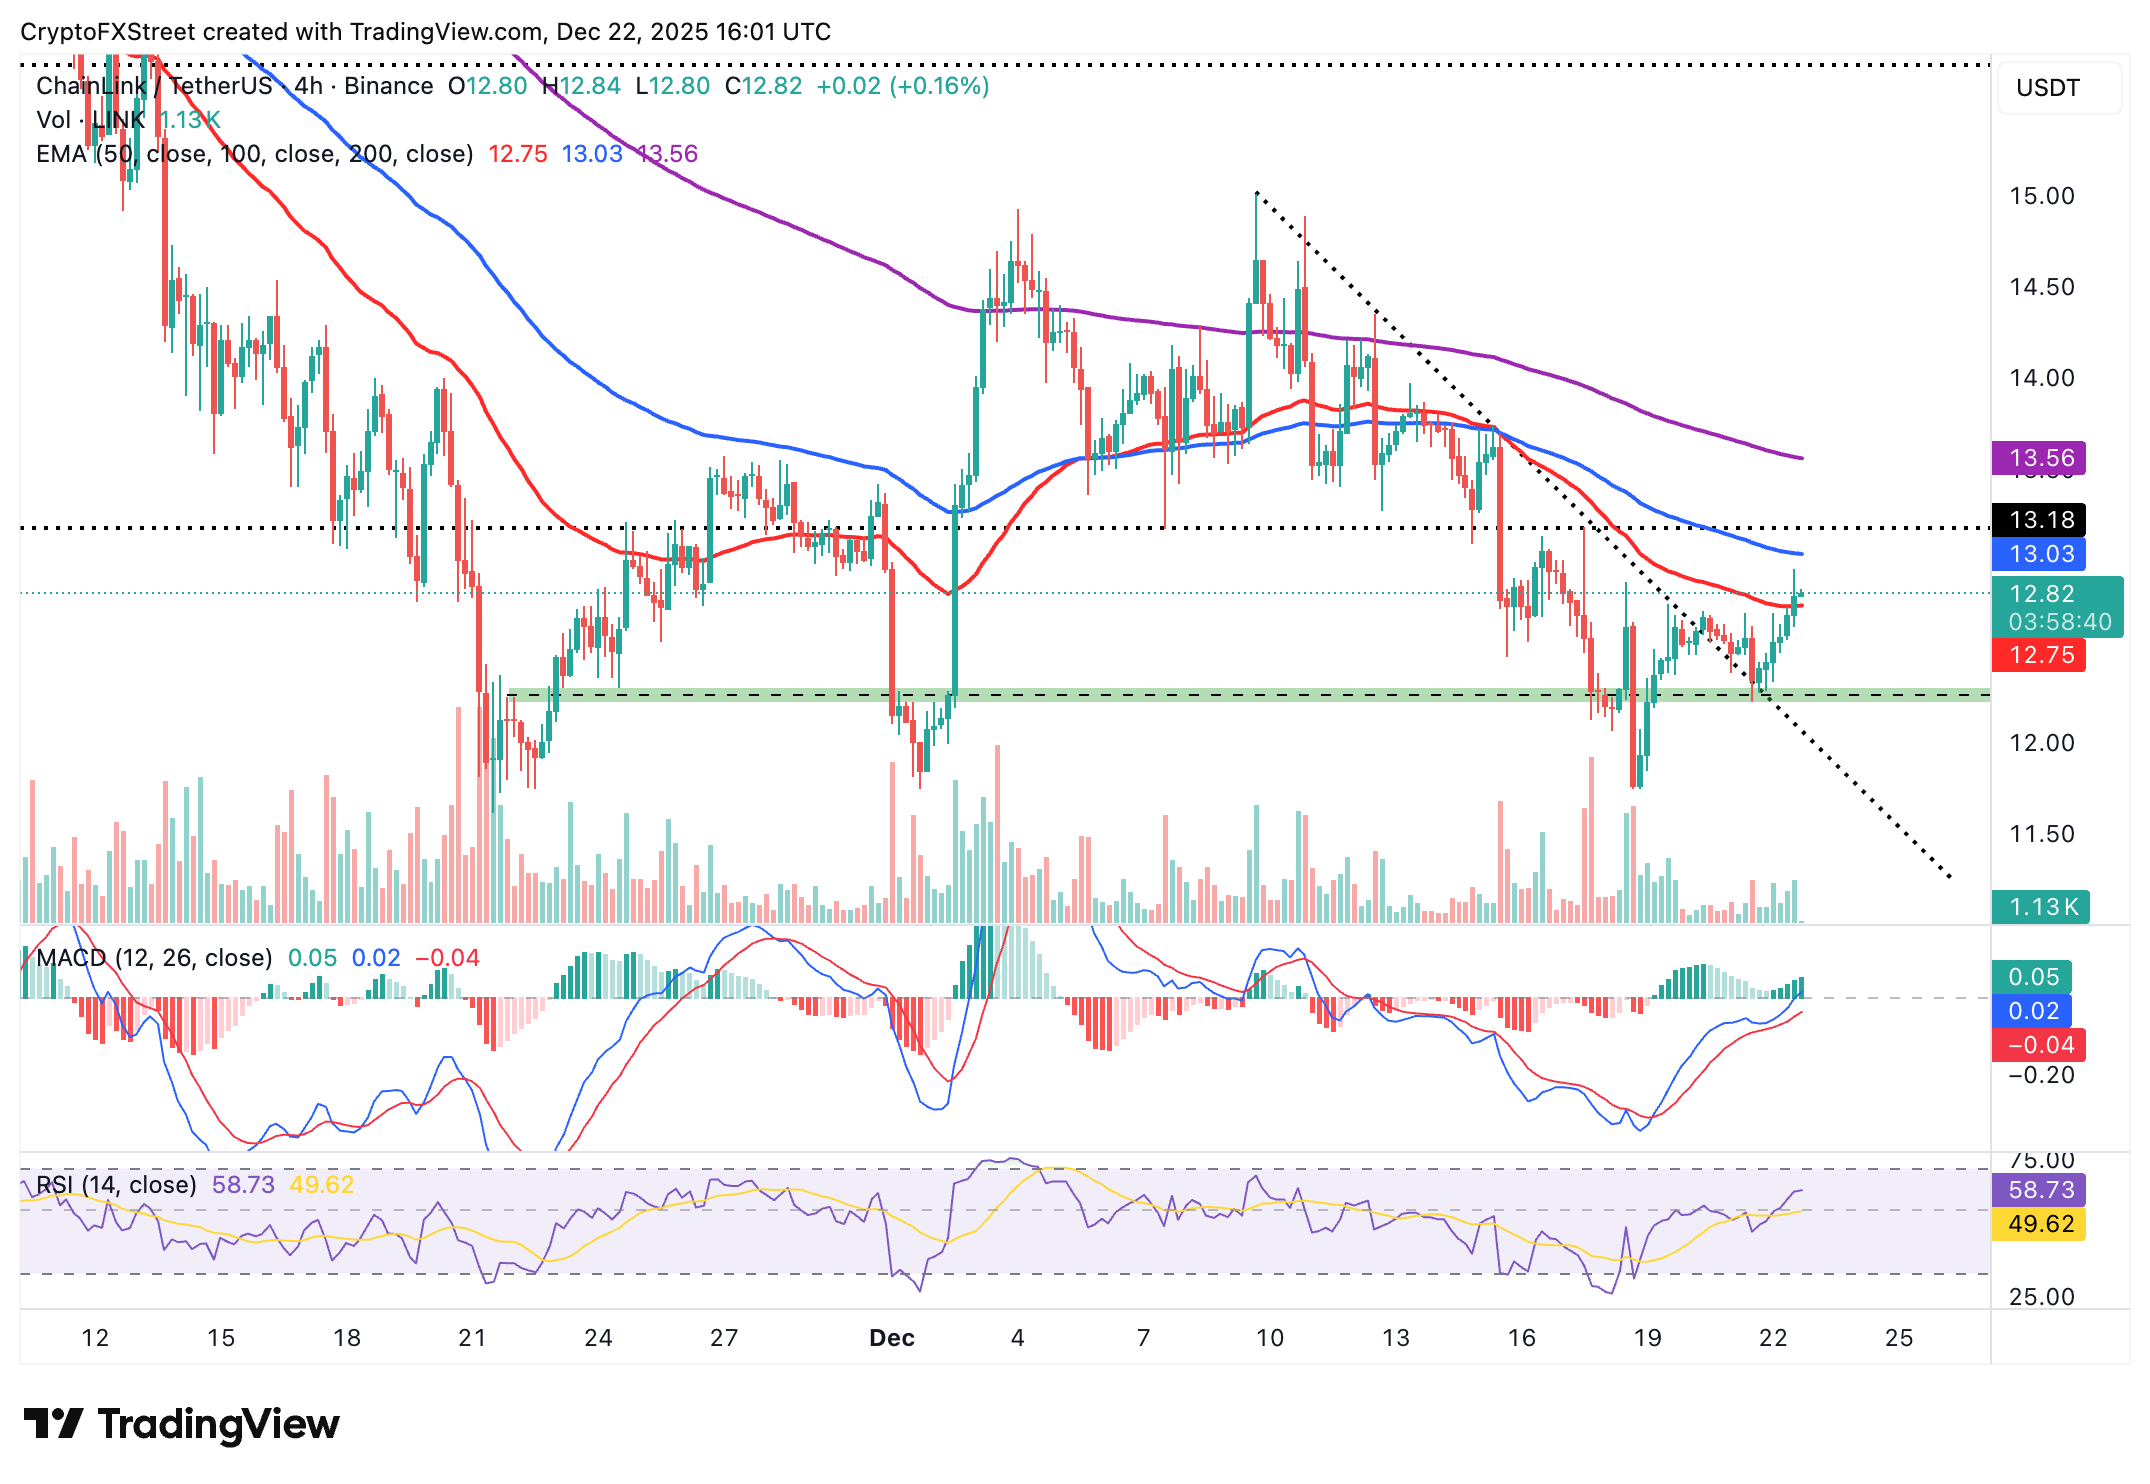
Still, if profit-taking overwhelms demand, Chainlink’s recovery could stall amid the risk of a resumption of the downtrend below the 50 EMA at $12.75. A close above the same moving average may reinforce the bearish thesis, increasing the likelihood that LINK drops to the $12.22 support, last tested on Sunday.
Open Interest, funding rate FAQs
Higher Open Interest is associated with higher liquidity and new capital inflow to the market. This is considered the equivalent of increase in efficiency and the ongoing trend continues. When Open Interest decreases, it is considered a sign of liquidation in the market, investors are leaving and the overall demand for an asset is on a decline, fueling a bearish sentiment among investors.
Funding fees bridge the difference between spot prices and prices of futures contracts of an asset by increasing liquidation risks faced by traders. A consistently high and positive funding rate implies there is a bullish sentiment among market participants and there is an expectation of a price hike. A consistently negative funding rate for an asset implies a bearish sentiment, indicating that traders expect the cryptocurrency’s price to fall and a bearish trend reversal is likely to occur.

Acuity Trading은 2013년에 설립된 런던 기반 핀테크로, AI 기반 대체 데이터와 심리 분석을 통해 트레이딩과 투자를 지원합니다. 시각화된 뉴스와 심리 도구로 온라인 트레이딩 경험을 혁신했으며, 최신 AI 연구와 기술로 알파를 창출하는 대체 데이터와 높은 몰입도의 트레이딩 도구를 제공하며 시장을 선도하고 있습니다.
더 읽기


